 |
||||||||
|
|
||||||||
 |
 |
|||||||
THE TORONTO CENTRE FOR PHENOGENOMICS
MOUSE IMAGING CENTRE |
|
|
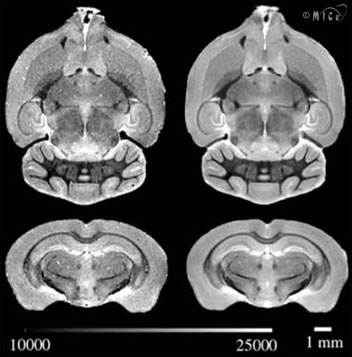
Variational Mouse Brain AtlasA fundamental question when studying mice is “Is this mouse an outlier?” This question is easily answered when measuring one-dimensional parameters like heart rate or red blood cell count. The measurement obtained in the subject mouse is simply compared to the population mean and standard deviation. The situation is not quite as easy when dealing with large and complicated image datasets. We have developed image registration tools to “morph” together nine age- and sex-matched 129SV/S1 mouse brains. The average brain as well as some 40 labelled substructures are available through a 3D viewer developed by the Pittsburgh Supercomputing Centre: Mac OS X Users: download the vb.dmg file; when you open this file, it will contain the vb (Volume Browser) application, which you can run directly from the DMG or, if you want to use it more than once, drag it to a location such as /Applications. Windows Users: download the vb_win.zip file; this file contains the vb.exe program as well as the glut32.dll which implements some graphics features; these two files must be installed in a directory on your system from which you will run the vb (Volume Browser) application. Navigation suggestions: Load up the Dataset “Toronto Mouse Brain”:
ReferenceKovacevic, N., Henderson, J.T., Chan, E. Lifshitz, N., Bishop, J. Evans, A.C., Henkelman, R.M. & Chen, X.J. 3D Atlas of average and variability for an inbred mouse brain. Cer. Cortex. (In press). Other LinksPittsburgh Supercomputing Centre http://www.psc.edu
|
|||
|
© 2004 The Centre for Phenogenomics |
|